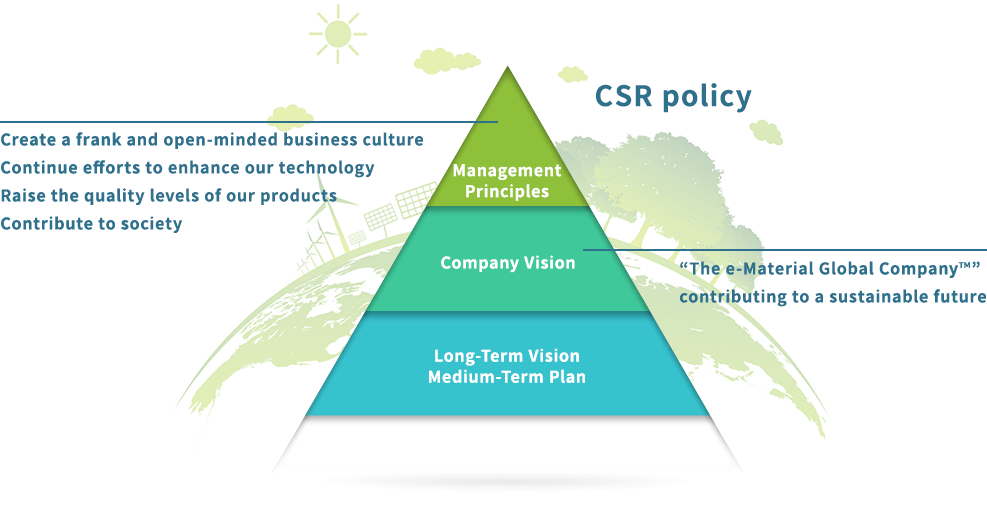
Environmental Activities

Promotion of recycling, managing chemical substances,
and approaches toward energy saving.
Environmental Activities
Address Climate Change Issues toward Decarbonization
Basic Concept
We belong to the Japan Chemical Industry Association (“JCIA”). JCIA participated in the Keidanren(Japan Business Federation)'s Low Carbon Society Action Plan. The association takes global warming countermeasures in below four points:
(1)Curbing CO2 emissions from business activities in Japan
(2)Strengthening cooperation among companies to promote the reduction of CO2 emissions throughout the supply chain by the dissemination of low-carbon products/technologies
(3)Promoting Japanese chemical products to the world and contributing to economic and social development of countries around the world
(4)Developing innovative technologies in mid-to-long term
We are also working to reduce our environmental impact by fully analyzing the influence of our production activities on the environment, including the influence of emissions in the value chain, in accordance with the Low Carbon Society Action Plan. Since its establishment in 1940, one of our management philosophies has been to "contribute to society." We unveiled our long-term vision, “TOK Vision 2030” in 2020, aiming to become "The e-Material Global Company" contributing to a sustainable future through chemistry. Under this vision, we will strive both to promote environmental management through the development and supply of new and existing products and to address the issue of climate change toward the goal of decarbonization.
In January 2022, TOK announced its support for the recommendations of the Task Force on Climate-related Financial Disclosures, TCFD. Based on its support for the TCFD recommendations, we will strive to analyze business risks and the opportunities presented by climate change and proactively disclose information, while also helping global environmental protection through our businesses, together with all our stakeholders.
Emissions of Greenhouse Gases
Because climate change has become more serious in recent years, companies are expected to measure greenhouse gas emissions from their own properties and across the entire value chain. The TOK Group measures and calculates greenhouse gas emissions based on the Ministry of the Environment’s Basic Guidelines on Accounting for Greenhouse Gas Emissions throughout the supply chain within the context of emissions from business activities (Scope 1 and Scope 2) and indirect emissions from nonbusiness activities (Scope 3). TOK will advance the initiatives for the realization of a sustainable society by identifying issues throughout the value chain where corporate activities can have an impact. In terms of our materiality, "conserving the global environment," we are addressing the issue of climate change in order to "decarbonize."
Scope 1 | 10,313t-CO2 | Scope 2 | 20,627t-CO2 |
---|
Scope 3 Emissions by Category
SCOPE3 | |||
---|---|---|---|
Purchased goods and services | 31,297t-CO2 | Upstream leased assets | - |
Capital goods | Not applicable | Downstream transportation and distribution | Domestic: 2,582t-CO2 |
Overseas: 3,812t-CO2 | |||
Fuel-and energy-related activities not included in Scope 1 or 2 | - | Processing of sold products | Not applicable |
Upstream transportation and distribution | Not applicable | Use of sold products | Not applicable |
Waste generated in operations | 9,018t-CO2 | End-of-life treatment of sold products | Not applicable |
Business travel | 397t-CO2 | Downstream leased assets | - |
Employee commuting | 602t-CO2 | Franchises | - |
Investments | Not applicable |
Improve Energy Consumption per Base Unit and CO2 Emissions
When equipment is introduced or replaced, we endeavor toselect models with higher energy efficiency in order to improve the system of each site and optimize the system as a whole.
Energy consumption in 2020 increased by 5% year-overyear because the new R&D Building, which was completed at the Sagami Operation Center in 2019, and one more new building, started full-scale operation, while a variety of improvement measures were implemented, including the replacement of air-conditioning equipment and the shift to LED lighting at certain sites, review of air-conditioning temperature settings, and the survey of illuminance and lighting followed by adjustment to optimal illuminance.
Energy consumption per base unit decreased by 9 points year-over-year, reflecting more efficient production at the Koriyama plant, Gotemba plant, and several other plants. Energy-related CO2 emissions per base unit decreased by 11 points year-over-year owing to increased net sales, coupled with the shift of the total amount of electricity used at the headquarters to renewable energy starting January 2020.


Energy Consumption
× ncreased by 5% YoY(16,141 kL crude oil equivalent)
Energy Consumption (per base unit)
〇 Reduced by 9 points YoY (Target:reduce by 1 point YoY)
CO2 Emissions (per base unit)
〇 Reduced by 11 points YoY (Target:reduce by 1 point YoY)
Improve Energy Consumption in Distribution
For the quality and safety management of products, the Company ensures rigorous temperature control during product storage and transportation. The product storage warehouse is single-storied and requires refrigeration and freezing equipment. Product transportation also requires freezer trucks.
TOK endorses the aim of the White Logistics Promotion Movement and is taking steps to realize sustainable logistics, while working with partner logistics companies to improve energy consumption. In 2020, we introduced new vehicles to improve fuel efficiency. We reviewed the efficiency of transportation routes (such as closure of the Ibaraki SP* among the product storage sites in Japan and distribution starting from neighborhood plants) and kept CO2 emissions at the same level as last year. At present, we are preparing for logistics optimization ranging from the purchase of raw materials to the distribution of products based on the monitoring of warehouse occupancy at each site.
* Stands for constant-temperature constant-humidity stock point
Participation in White Logistics Promotion Movement (in Japanese)

Measures to Prevent Global Warming at Overseas Manufacturing Sites
The overseas ratio of energy consumption temporarily decreased in 2019 but started to increase again in 2020. The probable causes are the increased production equipment and extended cleanrooms at production sites in the United States and South Korea combined with an increase in production volume. Going forward, TOK will continue its production activities with a focus on energy conservation through a PDCA cycle for environmental management systems.

Year | Domestic total(kL) | Overseas total(kL) | Overseas ratio(%) |
---|---|---|---|
2016 | 14,384 | 8,030 | 35.8 |
2017 | 14,838 | 8,952 | 37.6 |
2018 | 14,527 | 9,155 | 38.7 |
2019 | 15,389 | 9,108 | 37.2 |
2020 | 16,141 | 10,033 | 38.3 |
Environmental Accounting*
TOK has been using environmental accounting since 2000. This allows the Company to conduct environmental management while monitoring the expenses and effects of environmental programs. In 2020, environmental conservation expenses totaled ¥1,025 million, mainly for the prevention of pollution and the recycling of resources.
* Environmental accounting: A system for understanding environmental conservation related investments made by, and expenses incurred by, businesses and other organizations, as well as the effects of such investments, in quantitative terms (currency or physical quantity) and communicating such information to stakeholders
(Millions of yen)
Category | Key Initiatives | Investment | Cost | |
---|---|---|---|---|
Business area cost | Pollution prevention cost |
Air, water, and other pollution prevention equipment and the renewal, operation, maintenance, and management of equipment Installation of flood control facilities | 69 | 74 |
Global environmental conservation cost | Energy conservation activities | 467 | 11 | |
Resource circulation cost | Installation of melting equipment | 0 | 173 | |
Upstream/Downstream cost | Green purchasing, collection of used products | 0 | 9 | |
Administration cost | Approach to environmental management system | 104 | 64 | |
R&D cost |
Research and development related to environmental conservation (costs for chemical substances screening) | 0 | 51 | |
Social activity cost | Cleanup activities around the production plants | 0 | 0 | |
Environmental remediation cost | Treatment of soil pollution by the construction of a new building | 3 | 0 | |
Total | - | 643 | 382 |
※January 2019 to December 2019
Economic Benefits Associated with Environmental Conservation Measures
(Millions of yen)
Effects | Amount | |
---|---|---|
Revenue | Gains on the sale of recycled products | 22 |
Cost savings | Reduction in disposal costs through reduction in the volume of waste | 103 |
Total | - | 125 |
* January 2020 to December 2020
*1 Scope of environmental accounting covers production facilities in Japan and distribution centers, excluding the headquarters and marketing offices. Reference used is the Environmental Accounting Guidelines 2005, published by the Ministry of the Environment.
*2 Amounts of less than one million yen have been rounded off.
Promotion of Resource Recycling:Initiatives to Address Water Risk
Basic Concept
Amid increasing public attention to the social issue of water resources, the Group’s products and manufacturing processes use water as an essential resource. Therefore, we strive to minimize the volume of water consumed in production activities and to maintain and improve the quality of wastewater. We aim to contribute more through business activities that consider the global water risks.
Water Usage Volume
Water use volume changes when manufacturing processes and output change. TOK works to reduce its use by constantly monitoring the state of industrial water and city water use and reviewing related equipment.
In 2020, water use volume in Japan increased slightly from the previous year to 370,000 m3. Overseas, water use volume at our sites increased by 11,000 m3 from the previous year to 354,000 m3 due to the increased production volume.

Water Risk Management
Water risks and other natural resource risks are widely recognized as serious worldwide risks that are ranked among the five greatest risks in the Global Risks Report 2021 published by the World Economic Forum.
We have utilized the World Resources Institute (WRI) water risk map (Aqueduct) to conduct surveys in water-stressed regions. As a result, we were found to be operating in water-stressed areas in China.
Water withdrawals in water stressed region (m3)
2018 | 2019 | 2020 | |
---|---|---|---|
China | 356 | 179 | 151 |
To better understand water use volume at all sites around the world, the TOK Group has clarified the respective risks in the stages of water supply, raw materials supply, manufacturing processes, and wastewater emissions from plants. TOK then examined the measures to implement for water risks in the supply chain, including water intake restriction and flooding risks due to natural disasters, and the risk of business interruption resulting from water contamination.
Set a Medium- to Long-Term Target
We began aggressive efforts to reduce water risks in 2018. In 2019, we set a long-term target of reducing water consumption by 13% from 2017 levels by 2030, and also set an annual target of reducing water consumption by 3% from 2017 levels by 2020. In 2020, we implemented the Water Risk Reduction Project at our all domestic sites. we examined reduction measures for the risk of contamination of piping and equipment at each site, water use operation, and measures to reduce natural disaster risks, and performed the relevant activities based on the plans. We will continue to implement risk reduction measures to attain the long-term target of reducing water use by 15% from the 2019 level by 2030. As a result, water consumption in 2020 decreased by 8.3% compared to 2017, achieving the target.
Since 2021, we have set a new target of reducing water consumption by 15% from 2019 levels by 2030, and are implementing measures at each site. In 2021, the Gotemba Plant started initiatives to recycle and reuse water used in inspection equipment. As a result, water consumption in the plant was reduced compared to the previous year.
Future Issues and Initiatives
There are concerns about the impact of water stress caused by climate change on water resources. Difficulties may increase in the environment surrounding product manufacturing due to water intake restrictions and discharge limitations imposed by more stringent regulations. To protect equipment from floods, flood control work is in progress at the Sagami Operation Center as our R&D hub, and standards of conduct in the event of a flood are being formulated at each site. We continue working to minimize water stress and water risk by reducing water use, reducing pollution risks, and examining the impact of natural disasters.
Promotion of Resource Recycling: Reducing Industrial Waste Emissions and Landfill Disposal
Basic Concept
We conduct 3R activities (reduce, reuse, and recycle) for the effective use of limited natural resources. By restricting the volume of generated waste, thoroughly sorting all waste by type, and increasing the volume that is recycled, we are working to make more effective use of resources. We strive to maintain zero emissions* by reducing the landfill disposal volume by processing waste products through combustion or crushing, which is called intermediate treatment, and through stabilization and volume reduction initiatives.
* Zero emissions: Landfill disposal volume (direct or after intermediate treatment) of less than 1% of industrial waste discharged by production activities
Reduce Industrial Waste Emissions
In 2016, TOK set a new medium-term target to reduce industrial waste (per base unit) by 5 points by 2020 compared with 2015 (reduction of 1 point annually). With this target in mind, TOK has been working to reduce industrial waste by refining and reusing process effluents, internal effluent processing, internal recovery, and converting waste into items of value.
In 2020, as the final target year, our efforts to proactively reuse process effluents and convert waste into items of value succeeded in attaining the target by reducing our waste generation by 11 points compared with 2015 as the base year of the Medium-Term Management Plan, though the value was an increase by 15 points from the previous year due to the increased production volume. In 2021, TOK will set new targets indexed to 2019 and further continue reduction efforts.
Achieved Zero Emissions
We set a target of reducing the amount of industrial waste disposed in landfills to less than 1% of all waste. In 2020, industrial waste for landfill disposal after intermediate treatment stood at less than 1% of total waste, so we have achieved zero emissions for seven consecutive years since 2014.
Scope | Unit | 2018 | 2019 | 2020 | |
---|---|---|---|---|---|
Volume of industrial waste*1 | not-consolidated | t | 3,980 | 3,690 | 4,380 |
Landfill Waste(Non-recycled waste) | not-consolidated | t | 36 | 36 | 38 |
Recycling rate*2 | not-consolidated | % | 99.10 | 99.02 | 99.13 |
*1 General industrial waste + Specially controlled industrial waste
*2 Landfill Waste ÷ Volume of industrial waste

Industrial Waste Emissions
◯ Reduced by 11 points compared with 2015(Target: Reduce by 5 points compared with 2015)
Techniques for Recycling Organic Solvent Effluents
TOK strives to effectively use the waste generated by its plants. Waste oil is sorted by type of recyclable solvent, and ratings of impurities and purity are introduced with strengthened control applied. In this way, it is possible to reuse waste oil that was previously disposed of as industrial waste. It is now also possible to use waste oil with a mixture of organic solvents as combustion improvers by blending with other waste oil of differing calories and water content. In addition, the Gotemba Plant collaborates with external partner Nippon Refine Co., Ltd. (hereafter, the Company) to realize reductions in waste and resource use. The company is engaged in efforts to promote resource recycling, mainly in the refining and recycling business. Waste oil generated at our plants is distilled at the company's facilities and reused as raw materials in the production process, thereby realizing recycling. We will continue to promote the effective use of such resources and work to curb the amount of industrial waste discharged.
To realize a circular economy

Reduce activities
We conduct a range of activities to reduce waste to the fullest extent possible at all TOK manufacturing sites inside and outside Japan, including the internal processing of waste fluid through water treatment facilities, converting waste into items of value by promoting sorting, and reducing the generated waste through modifications of the manufacturing processes.
Reduce: This refers to reducing the volume of waste material generated. Reduction involves minimizing the volume of materials in products in order to minimize the volume of materials that is eventually discarded.
Reuse activities
Products incorporating organic solvents have been placed in stainless steel containers since the late 1970s. This allows empty containers to be returned to TOK for reuse. In addition, some products are transported using tanker trucks. We are also beginning to use reusable containers for some photoresist products, chiefly those used in the manufacture of LCD panels.
Reuse: This refers to the repeated use of manufactured goods, containers, and other products in order to reduce the volume of waste materials generated and to conserve resources.
Recycle activities
We recover the organic solvents (process effluents) used in the manufacturing processes and refine those solvents on-site, so these chemicals can be reused for the same processes, among other measures to reduce industrial waste generation. At the same time, raw materials that can be reused through distillation and refining are recycled with the help of trusted partners (recycling companies).
Recycle: This refers to the use of waste materials as resources rather than incinerating these materials or sending them to a landfill, thereby conserving resources and preventing pollution.
Air, Water and Soil/Biodiversity
Basic Concept
The Group takes steps to lighten its environmental impact by reducing the emissions of greenhouse gases* and chemical substances and by upgrading equipment, switching fuels, and reviewing the manufacturing processes to preserve the air, water, and soil environments upon which our livelihoods depend.
Reducing the emissions of air-polluting substances
TOK has shifted to boilers that use natural gas to reduce the emissions of sulfur oxide (SOx) and nitrogen oxide (NOx), which are major contributors to air pollution. Boilers at all plants now use low-emission natural gas as fuel with the exception of plants without access to city gas supplies. In 2020, SOx emissions related to production activities decreased by 0.1 tons year-over-year. NOx emissions decreased by 3.3 tons yearover-year, mainly because of the review of the operating program and other improvements in the method of operation of the electric power generator at the Koriyama plant.
Monitoring soil pollution
The TOK Group manages the risk of soil and underground water pollution by recognizing the concerns that such pollution could threaten the safety and health of local residents and employees. In the event surveys discover soil or underground water pollution, the Company rapidly discloses information and takes remedial action to ensure the health and safety of local residents.
In addition, the Sagami Operation Center of TOK is a member of the Koza River Purification Association, which comprises the plants, offices, and municipalities located along the rivers in the Koza District of Kanagawa Prefecture. As such, the Center endeavors to conserve water quality and maintain and improve the environment of the rivers in the neighborhood.
Reducing emissions of water-polluting substances
TOK set its own management standards for treating the wastewater from its sites. The standards are stricter than the regulations, laws, and local ordinances for purifying wastewater, such as activated sludge processing, at its process wastewater treatment facilities. Only water that satisfies the standards for cleanliness is released into the public water system.
The Company also periodically evaluates water quality for compliance with its own standards and public laws and regulations. TOK will continue to reduce emissions by maintaining and managing its process wastewater treatment facilities so that water can be released after satisfying all applicable standards.
BOD emissions in the water discharged into public waters in 2020 were approximately 0.2 tons, while COD emissions were 0.4 tons.

SOx Emissions
◯ Reduced by 0.1 ton YoY
NOx Emissions
◯ Reduced by 3.3 tons YoY
BOD Emissions
〇 Reduced by 0.1 ton YoY
COD Emissions
△ No change
Countermeasures against Ozone-Depleting Substances
The TOK Group uses the ozone-depleting chlorofluorocarbons CFC-11 and CFC-12 as coolants in refrigerators and freezers. The entire Group is working to reduce the equipment that uses these substances and to switch to alternative substances and green coolants (non-CFC). The revised Act on the Rational Use and Proper Management of Fluorocarbons mandates regular inspections and reporting of any leakage volume, and TOK is updating its environmental system for the proper management, filling, and disposal of CFCs. As a result of implementing the appropriate measures, TOK’s estimated leakage of CFCs in 2020 was approximately 156 t-CO2 based on the Act. TOK will continue to conduct group-wide inspections and periodically replace fire extinguishers that use ozone-depleting substances with the aim of further strengthening management to prevent any CFC leakage.
* Data collection period: April 2020 to March 2021
Comply with PRTR Law
Under the Japanese Pollutant Release and Transfer Register (PRTR) Law, companies must manage and report to the government the production, release, and transfer of designated chemicalsubstances. To accurately calculate and report these figures, TOK relies on its chemicals and PRTR management system.
Of the Class I Designated Chemical Substances, a list of 462 substances defined by the PRTR Law, TOK handled 44 substances (a total of 1,113 tons) in 2020, including an estimated 2 tons released into the atmosphere and public water systems. TOK measures the emissions of VOCs and harmful air-polluting substances through PRTR surveys with the Japan Chemical Industry Association, of which it is a member.
* Data collection period: April 2020 to March 2021
Government ordinance number | Chemical substance name | Emission volume (tons) | Transferred volume (tons) | |
---|---|---|---|---|
Air | Water | Waste Materials | ||
20 | 2-aminoethanol | 0.0 | 0.0 | 0.0 |
53 | ethylbenzene | 0.4 | 0.0 | 3.5 |
58 | ethylene glycol monomethyl ether | 0.0 | 0.0 | 0.1 |
80 | xylene | 1.5 | 0.0 | 10.0 |
83 | cumene | 0.0 | 0.0 | 0.0 |
86 | cresol | 0.0 | 0.0 | 12.3 |
150 | 1,4-dioxane | 0.4 | 0.0 | 0.4 |
181 | dichlorobenzene | 0.0 | 0.0 | 2.6 |
213 | N,N-dimethylacetamide | 0.0 | 0.0 | 0.7 |
232 | N,N-dimethylformamide | 0.0 | 0.0 | 1.5 |
296 | 1,2,4-trimethylbenzene | 0.0 | 0.0 | 0.0 |
297 | 1,3,5-trimethylbenzene | 0.0 | 0.0 | 0.0 |
300 | toluene | 0.0 | 0.0 | 0.0 |
302 | naphthalene | 0.0 | 0.0 | 4.1 |
320 | nonylphenol | 0.0 | 0.0 | 0.3 |
349 | phenol | 0.0 | 0.0 | 4.1 |
368 | 4-tert-butylphenol | 0.0 | 0.0 | 0.1 |
374 | hydrogen fluoride and its water-soluble salts | 0.0 | 0.0 | 2.5 |
411 | formaldehyde | 0.0 | 0.0 | 0.2 |
438 | methylnaphthalene | 0.0 | 0.0 | 1.3 |
Preserve Biodiversity
The TOK Biodiversity Protection Declaration guides the TOK Group’s activities to preserve biodiversity. In 2020, 185 employees participated in biodiversity training, and six employees were dispatched to help with afforestation projects in cooperation with local residents through the Kanagawa Trust Midori Foundation. We will continue to preserve biodiversity with the intention of starting a ripple effect inside and outside the Company and spreading them throughout society.
TOK Biodiversity Protection Declaration
1. We will position biodiversity protection as one of management’s highest priorities and strengthen protection activities for the global environment |
Regarding Groundwater Pollution at the Sagami Operation center
In December 2020, voluntary inspections of groundwater pollution detected arsenic and arsenic compounds exceeding standard values at the Sagami Operation Center. We took careful action to prevent the spread into the surrounding areas and have adequately responded to all administrative instructions, including the prompt conduct of a flow survey. As of May 2021, no pollution has been detected by these substances. We will continue to conduct periodic monitoring.
Future Issues and Initiatives
The TOK Group has implemented a variety of activities and measures to prevent global warming and the pollution of the air, soil, and water and has worked to maintain biodiversity. In all these categories, we will continue to appropriately maintain and manage our facilities and equipment to ensure continuous normal operation, thereby fulfilling our social responsibility as a company handling chemical substances.
Information on environmental impact by site
Input | |||||||
---|---|---|---|---|---|---|---|
Electric Power [thousand kWh] | Heavy oil [kL] | City gas [thousand m3] | Gasoline [kL] | LPG [tons] | Light gas oil [kL] | Used water [thousand m3] | |
Headquarters | 713 | 0 | 7 | 0 | 0 | 0 | 4.1 |
Sagami Operation Center | 17,744 | 0 | 2,629 | 0 | 12.4 | 0.4 | 110.8 |
Shonan Operation Center | 3,162 | 0 | 41 | 0 | 0 | 0 | 6.1 |
Koriyama Plant | 10,073 | 197 | 717 | 0 | 0 | 19.9 | 95.4 |
Utsunomiya Plant | 2,512 | 0 | 160 | 0 | 2.8 | 0 | 16.8 |
Kumagaya Plant | 83 | 10 | 0 | 1 | 0 | 0 | 2.6 |
Gotenba Plant | 5,096 | 0 | 329 | 1.7 | 1 | 0 | 53.9 |
Aso Plant | 3,563 | 291 | 0 | 13.8 | 2.1 | 0 | 78.2 |
Distribution Control Center | 887 | 0 | 0 | 0 | 16.5 | 12.7 | 2.5 |
Total | 43,833 | 498 | 3,882 | 16.7 | 34.7 | 33 | 370.4 |
Output | |||||
---|---|---|---|---|---|
CO2 [thousand tons] | SOx [tons] | Nox[tons] | BOD [kg] |
COD [kg] | |
Headquarters | 0.3 | 0 | 0 | 0 | 0 |
Sagami Operation Center | 14.1 | 0 | 0 | 5.6 | 9.7 |
Shonan Operation Center | 1.5 | 0 | 0 | 0 | 0 |
Koriyama Plant | 7.4 | 0.3 | 3.1 | 91.5 | 120.7 |
Utsunomiya Plant | 1.5 | 0 | 0 | 19.6 | 41.8 |
Kumagaya Plant | 0.1 | 0 | 0 | 0 | 0 |
Gotenba Plant | 3.1 | 0.1 | 0 | 50.7 | 146.7 |
Aso Plant | 2.4 | 0.4 | 0 | 5.6 | 9.7 |
Distribution Control Center | 0.5 | 0 | 0 | 0 | 0 |
Total | 30.9 | 0.8 | 3.1 | 173 | 328.6 |
Waste volume | Recycling Rate | |||||
---|---|---|---|---|---|---|
General administrative waste [tons] | General industrial waste [tons] | Specially controlled industrial waste [tons] | General administrative waste [%] | General industrial waste [%] | Specially controlled industrial waste [%] | |
Headquarters | 16.7 | 5.6 | 0 | 29% | 0% | 0% |
Sagami Operation Center | 0 | 403.4 | 59.2 | 0% | 28% | 93% |
Shonan Operation Center | 2.7 | 12.5 | 3.4 | 0% | 18% | 0% |
Koriyama Plant | 4 | 209.6 | 43.6 | 0% | 26% | 0% |
Utsunomiya Plant | 2.7 | 142.6 | 201.6 | 84% | 25% | 96% |
Kumagaya Plant | 0.7 | 5.4 | 0 | 0% | 100% | 0% |
Gotenba Plant | 2.4 | 520.9 | 1,332.70 | 100% | 2% | 97% |
Aso Plant | 2 | 585.9 | 762.4 | 100% | 86% | 100% |
Distribution Control Center | 2 | 10.8 | 79.1 | 96% | 0% | 0% |
Total | 33 | 1,897 | 2,482 | - | - | - |
*The date on Distribution Control Center includes date on all product stock points.
*Carbon dioxide emission factor is continue to use the emission factor for fiscal 2009.
*General administrative waste:Unneeded items (office refuse) other than industrial waste generated by offices
*General Industerial waste:Industrial waste that does not require special controls (Industrial waste is defined as waste produced in conjunction with business activities and includes cinders, sludge, used oils, used acids, used alkalines, used plastics and certain other materials.) *Specially controlled industrial waste:Industrial waste that requires special management due to its explosivity, toxicity, infectious properties or other hazards