GHG Reduction
Toward the goal of carbon neutrality in 2050 for global environmental conservation in consideration of future generations as a material issue, the TOK Group quantitatively measures the environmental impact throughout the value chain and works to reduce the environmental load, including CO2, with a full understanding of the impact that production activities have on the environment. TOK aims to achieve sustainable development with society through the development of photoresists and new products that further conserve resources and energy.
Basic Concept
We belong to the Japan Chemical Industry Association (“JCIA”). JCIA participated in the Keidanren(Japan Business Federation)'s Low Carbon Society Action Plan. The association takes global warming countermeasures in below four points:
(1)Curbing CO2 emissions from business activities in Japan
(2)Strengthening cooperation among companies to promote the reduction of CO2 emissions throughout the supply chain by the dissemination of low-carbon products/technologies
(3)Promoting Japanese chemical products to the world and contributing to economic and social development of countries around the world
(4)Developing innovative technologies in mid-to-long term
We are also working to reduce our environmental impact by fully analyzing the influence of our production activities on the environment, including the influence of emissions in the value chain, in accordance with the Low Carbon Society Action Plan. Since its establishment in 1940, one of our management philosophies has been to "contribute to society." We unveiled our long-term vision, “TOK Vision 2030” in 2020, aiming to become "The e-Material Global CompanyTM" contributing to a sustainable future through chemistry. Under this vision, we will strive both to promote environmental management through the development and supply of new and existing products and to address the issue of climate change toward the goal of decarbonization.
In January 2022, TOK announced its support for the recommendations of the Task Force on Climate-related Financial Disclosures, TCFD. Based on its support for the TCFD recommendations, we will strive to analyze business risks and the opportunities presented by climate change and proactively disclose information, while also helping global environmental protection through our businesses, together with all our stakeholders.
Emissions of Greenhouse Gases
Because climate change has become more serious in recent years, companies are expected to measure greenhouse gas emissions from their own properties and across the entire value chain. The TOK Group measures and calculates greenhouse gas emissions based on the Ministry of the Environment’s Basic Guidelines on Accounting for Greenhouse Gas Emissions throughout the supply chain within the context of emissions from business activities (Scope 1 and Scope 2) and indirect emissions from nonbusiness activities (Scope 3). In 2021, we also started to calculate Scopes 1 and 2 at overseas sites. TOK will advance the initiatives for the realization of a sustainable society by identifying issues throughout the value chain where corporate activities can have an impact.
| Scope 1 | 10,581t-CO₂e | Scope 2 | 161t-CO₂e |
|---|---|---|---|
| Scope 1(overseas total) | 3,069t-CO₂e | Scope 2(overseas total) | 15,113t-CO₂e |
Scope 3 Emissions by Category (domestic total)
| Cat. (Category) |
Name | Emissions | Cat. (Category) |
Name | Emissions |
|---|---|---|---|---|---|
| Cat. 1 | Purchased goods and services | 446,965 t-CO2e | Cat. 8 | Upstream leased assets | 85 t-CO2e |
| Cat. 2 | Capital goods | 61,705 t-CO₂e | Cat. 9 | Downstream transportation and distribution | — |
| Cat. 3 | Fuel and energy-related activities not included in Scope 1 and 2 |
6,121 t-CO₂e | |||
| Cat. 10 | Processing of sold products | — | |||
| Cat. 11 | Use of sold products | Not applicable | |||
| Cat. 4 | Upstream transportation and distribution | 18,259 t-CO₂e | Cat. 12 | End-of-life treatment of sold products | Not applicable |
| Cat. 5 | Waste generated in operations | 5,942 t-CO₂e | Cat. 13 | Downstream leased assets | — |
| Cat. 6 | Business travel | 194 t-CO₂e | Cat. 14 | Franchises | — |
| Cat. 7 | Employee commuting | 696 t-CO₂e | Cat. 15 | Investments | Not applicable |
| Cat. (Category) |
Name | Emissions | Cat. (Category) |
Name | Emissions |
|---|---|---|---|---|---|
| Cat. 1 | Purchased goods and services | 406,752 t-CO2e | Cat. 8 | Upstream leased assets | Not applicable |
| Cat. 2 | Capital goods | 25,694 t-CO₂e | Cat. 9 | Downstream transportation and distribution | — |
| Cat. 3 | Fuel and energy-related activities not included in Scope 1 and 2 |
5,776 t-CO₂e | |||
| Cat. 10 | Processing of sold products | — | |||
| Cat. 11 | Use of sold products | Not applicable | |||
| Cat. 4 | Upstream transportation and distribution | 15,384 t-CO₂e | Cat. 12 | End-of-life treatment of sold products | Not applicable |
| Cat. 5 | Waste generated in operations | 5,335 t-CO₂e | Cat. 13 | Downstream leased assets | — |
| Cat. 6 | Business travel | 207 t-CO₂e | Cat. 14 | Franchises | — |
| Cat. 7 | Employee commuting | 738 t-CO₂e | Cat. 15 | Investments | Not applicable |
* January 2024 to December 2024
* Business trips and commuting by employees exclude people seconded to other companies.
Major 2024 Initiatives and Future Key Measures
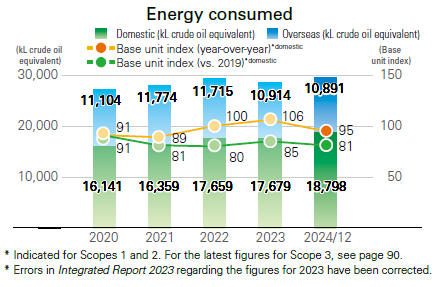
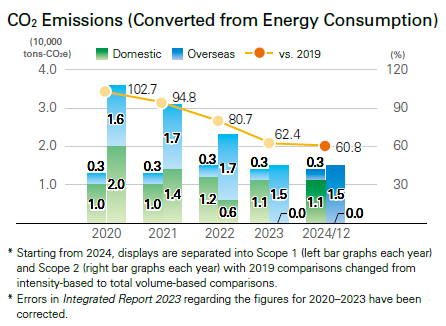
While some factors increased energy consumption in 2024, such as the completion of the Aso Kumamoto site of Aso Plant, energy consumption intensity at domestic sites decreased by 5 points year-over-year through power consumption efficiency improvements that included updating to high-efficiency energy equipment, solar panel installation, and LED lighting conversion. For energy-derived CO2 emissions, TOK began introducing renewable energy-derived electricity at domestic sites in 2021, and with conversion completed at all major domestic sites in 2023, the company achieved a 37.6% reduction compared to 2019 levels as of 2023. At overseas sites, the company is actively advancing CO2 emission reduction efforts, including solar panel installation aimed at improving the efficiency of energy use to help prevent global warming.
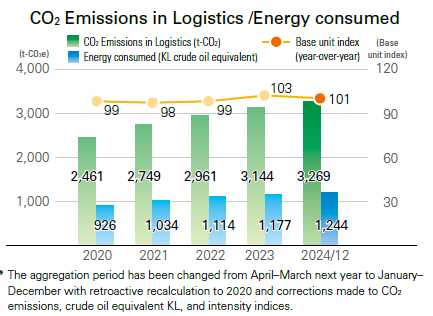
Additionally, the Logistics Department has worked to expand warehouse operations, including raw material inventory management,
in recent years under the mission of safely and accurately storing and transporting TOK products for delivery to customers both in Japan and worldwide. Furthermore, TOK is considering CO2 emission reduction through modal shifts that include railroad container use and marine transportation in impact from logistics as cargo handling volumes increase. Moreover, the distribution center is advancing energy conservation measures that include solar panel installation (2025) by working to reduce the environmental impact across our entire logistics network.
Going forward, the TOK Group will continue working to achieve 2050 carbon neutrality by advancing further energy conservation measures and renewable energy introduction for CO2 emission reduction both domestically and internationally, as well as by promoting centralized management through the deployment of environmental data collection systems to overseas sites, advancing group-unified activities.
![]()
Information on environmental impact by site
* Data collection period: January 2024 to December 2024
| item | Headquarters | TOK Technology and Innovation Center(TTIC) | Koriyama Plant | Utsunomiya Plant | Kumagaya Plant | |
|---|---|---|---|---|---|---|
| Input | Electric Power [thousand kWh] | 628 | 18,128 | 17,662 | 2,966 | 74 |
| Heavy oil [kL] | 0 | 0 | 74 | 0 | 1 | |
| City gas [thousand m3] | 8 | 2,848 | 1,268 | 153 | 0 | |
| Gasoline [kL] | 1 | 1 | 1 | 0 | 0 | |
| LPG [t] | 0 | 0 | 0 | 2 | 4 | |
| Light gas oil [kL] | 0 | 1 | 22 | 0 | 0 | |
| Used water [thousand m3] | 4 | 98 | 176 | 15 | 2 | |
| Output | CO₂[1,000tons] | 0 | 6 | 3 | 0 | 0 |
| SOx[t] | 0 | 0 | 0 | 0 | 0 | |
| Nox[t] | 0 | 0 | 0 | 0 | 0 | |
| BOD[kg] | 0 | 0 | 240 | 16 | 0 | |
| COD[kg] | 0 | 0 | 505 | 39 | 0 | |
| Waste volume | General administrative waste [t] | 13 | 2 | 4 | 4 | 1 |
| General industrial waste [t] | 4 | 125 | 262 | 96 | 1 | |
| Specially controlled industrial waste [t] | 0 | 46 | 548 | 143 | 1 | |
| Recycling Rate | General industrial waste [%] | 0 | 42 | 33 | 12 | 100 |
| Specially controlled industrial waste [%] | 0 | 65 | 100 | 100 | 0 |
| item | Gotenba Plant | Aso Plant | Distribution Control Center | Total | ||
|---|---|---|---|---|---|---|
| Input | Electric Power [thousand kWh] | 5,466 | 5,592 | 1,352 | 51,922 | |
| Heavy oil [kL] | 0 | 268 | 0 | 343 | ||
| City gas [thousand m3] | 308 | 0 | 0 | 4,585 | ||
| Gasoline [kL] | 0 | 1 | 0 | 4 | ||
| LPG [t] | 4 | 2 | 27 | 39 | ||
| Light gas oil [kL] | 0 | 8 | 8 | 39 | ||
| Used water [thousand m3] | 44 | 90 | 90 | 432 | ||
| Output | CO₂[1,000tons] | 1 | 1 | 1 | 11 | |
| SOx[t] | 0 | 0 | 0 | 0 | ||
| Nox[t] | 0 | 0 | 0 | 0 | ||
| BOD[kg] | 66 | 49 | 0 | 371 | ||
| COD[kg] | 109 | 97 | 0 | 750 | ||
| Waste volume | General administrative waste [t] | 4 | 3 | 1,318 | 1,349 | |
| General industrial waste [t] | 520 | 502 | 51 | 1,561 | ||
| Specially controlled industrial waste [t] | 1,492 | 884 | 111 | 3,225 | ||
| Recycling Rate | General industrial waste [%] | 2 | 66 | 0 | - | |
| Specially controlled industrial waste [%] | 79 | 80 | 0 | - |
| item | Headquarters | TOK Technology and Innovation Center(TTIC) | Shonan Operation Center | Koriyama Plant | Utsunomiya Plant | |
|---|---|---|---|---|---|---|
| Input | Electric Power [thousand kWh] | 598 | 17,977 | 568 | 15,880 | 2,880 |
| Heavy oil [kL] | 0 | 0 | 0 | 73 | 0 | |
| City gas [thousand m3] | 8 | 2,742 | 12 | 1,195 | 146 | |
| Gasoline [kL] | 1 | 2 | 1 | 0 | 0 | |
| LPG [t] | 0 | 0 | 0 | 0 | 1 | |
| Light gas oil [kL] | 0 | 0 | 0 | 21 | 0 | |
| Used water [thousand m3] | 4 | 100 | 7 | 141 | 17 | |
| Output | CO₂[1,000tons] | 0 | 6 | 0 | 3 | 0 |
| SOx[t] | 0 | 0 | 0 | 0 | 0 | |
| Nox[t] | 0 | 0 | 0 | 0 | 0 | |
| BOD[kg] | 0 | 18 | 0 | 180 | 20 | |
| COD[kg] | 0 | 21 | 0 | 322 | 47 | |
| Waste volume | General administrative waste [tons] | 12.0 | 4 | 1 | 5 | 1 |
| General industrial waste [tons] | 4.0 | 263 | 7 | 232 | 100 | |
| Specially controlled industrial waste [tons] | 0.0 | 58 | 2 | 492 | 155 | |
| Recycling Rate | General administrative waste [%] | 15% | 100% | 0% | 0% | 0% |
| General industrial waste [%] | 0% | 34% | 56% | 48% | 13% | |
| Specially controlled industrial waste [%] | - | 77% | 0% | 100% | 100% |
| item | Kumagaya Plant | Gotenba Plant | Aso Plant | Distribution Control Center | Total | |
|---|---|---|---|---|---|---|
| Input | Electric Power [thousand kWh] | 72 | 5,208 | 3,744 | 1,251 | 48,178 |
| Heavy oil [kL] | 1 | 0 | 269 | 0 | 343 | |
| City gas [thousand m3] | 0 | 300 | 0 | 0 | 4,403 | |
| Gasoline [kL] | 0 | 1 | 1 | 0 | 6 | |
| LPG [t] | 4 | 4 | 2 | 32 | 43 | |
| Light gas oil [kL] | 0 | 0 | 6 | 9 | 36 | |
| Used water [thousand m3] | 2 | 43 | 74 | 3 | 391 | |
| Output | CO₂[1,000tons] | 0 | 1 | 1 | 0 | 11 |
| SOx[t] | 0 | 0 | 0 | 0 | 0 | |
| Nox[t] | 0 | 0 | 0 | 0 | 0 | |
| BOD[kg] | 0 | 81 | 58 | 0 | 357 | |
| COD[kg] | 0 | 111 | 83 | 0 | 584 | |
| Waste volume | General administrative waste [tons] | 1 | 4 | 2 | 1,493 | 1,523 |
| General industrial waste [tons] | 1 | 511 | 576 | 36 | 1,730 | |
| Specially controlled industrial waste [tons] | 1 | 1,465 | 748 | 129 | 3,050 | |
| Recycling Rate | General administrative waste [%] | 100% | 100% | 100% | 92% | - |
| General industrial waste [%] | 100% | 2% | 80% | 37% | - | |
| Specially controlled industrial waste [%] | 17% | 98% | 100% | 0% | - |
*The data on Distribution Control Center includes data on all product stock points.
*“TTIC” includes the Shonan Satellite Lab, Osaka Satellite Lab, and Shonan Office.
* “Aso Plant” includes the Aso Kumamoto Site.
*General administrative waste:Unneeded items (office refuse) other than industrial waste generated by offices
*General Industerial waste:Industrial waste that does not require special controls (Industrial waste is defined as waste produced in conjunction with business activities and includes cinders, sludge, used oils, used acids, used alkalines, used plastics and certain other materials.)
*Specially controlled industrial waste:Industrial waste that requires special management due to its explosivity, toxicity, infectious properties or other hazards
Future Issues and Initiatives
Over the past several years, climate change has been manifested in stronger typhoons and torrential rainfall resulting in major damage to society. Climate change is thought to be caused by fluctuations in the oceans and changes in solar activity, as well as the global warming caused by the build-up of greenhouse gases and the warming of the oceans due to hot water discharged from electric power stations and other factors. Toward the target of achieving carbon neutrality in Scopes 1 and 2 by 2050, the TOK Group steadily implements a variety of CO2 emission reduction measures and energy conservation activities.
Related Material Issue


